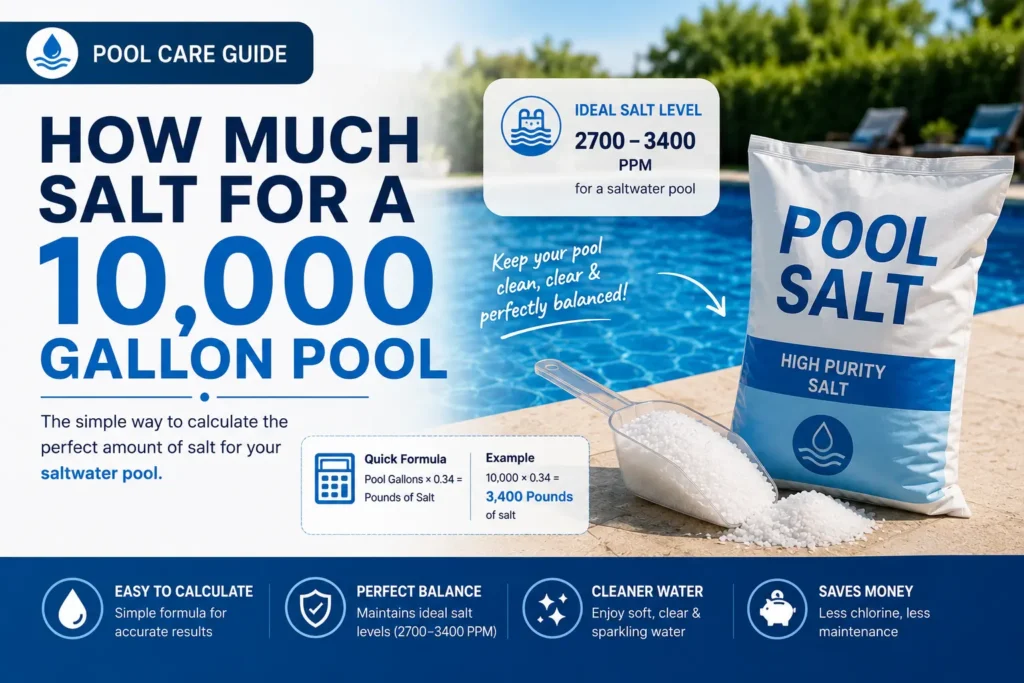
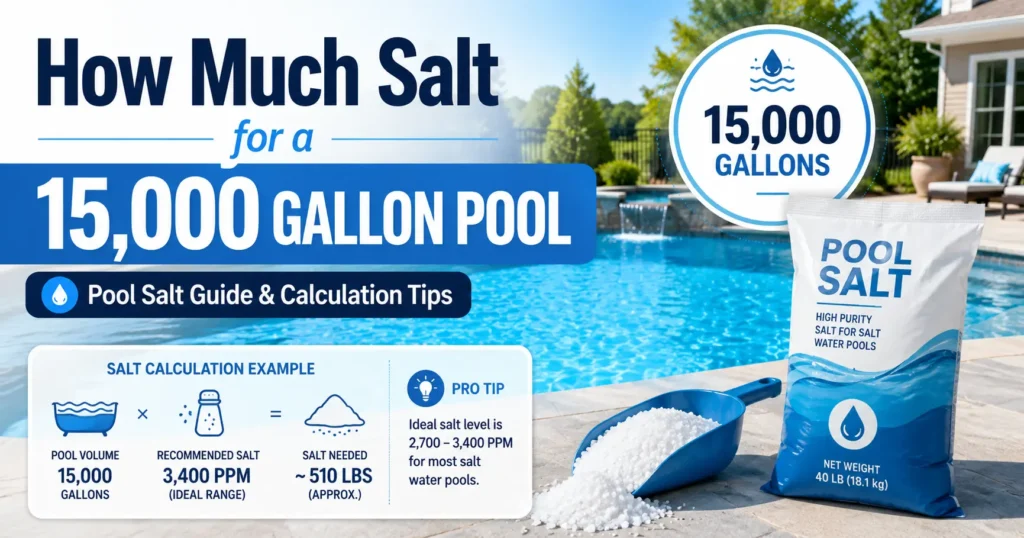
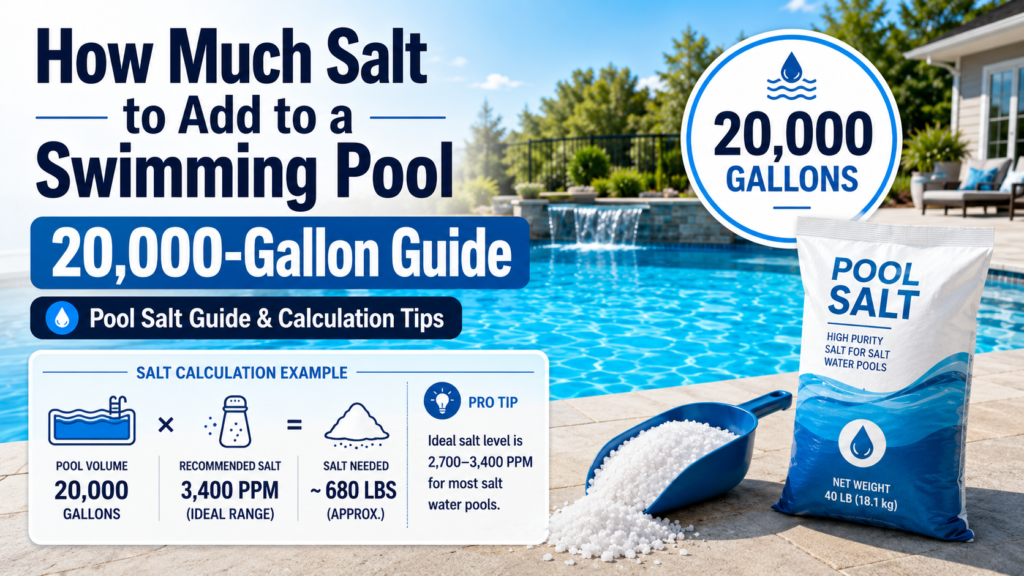
| Quick Answer A swimming pool salt chart matches your pool volume to the salt you need. Use the chart by matching pool volume with the required salt increase. For every 10000 gallons, a 500 ppm increase needs about 41.7 pounds of pure pool salt. Test the current level before using any chart. |
Introduction
A swimming pool salt chart lets you match your pool volume and target increase to the exact amount of salt to add. The sections below explain how to read it, with examples and common mistakes.
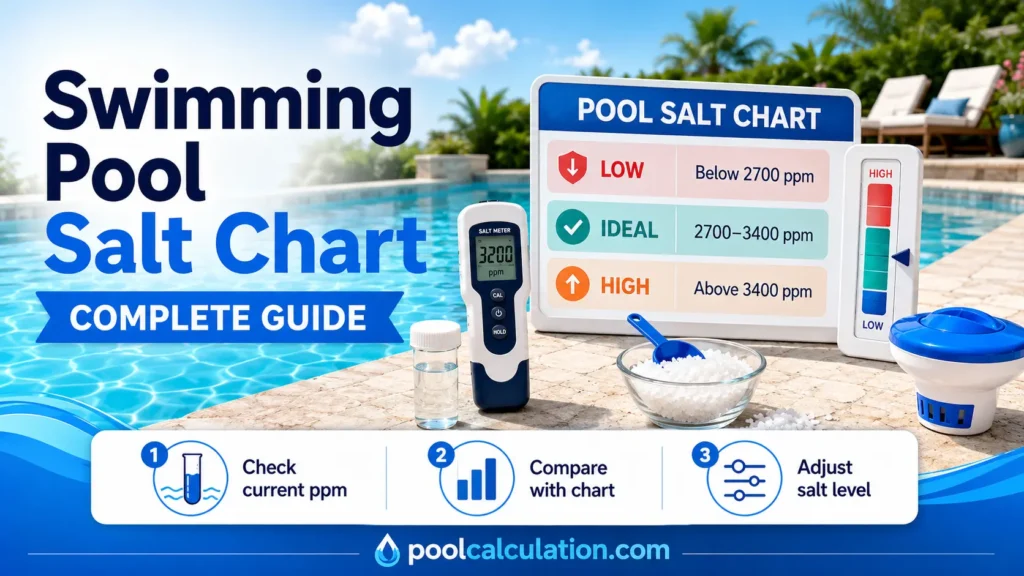
How to Read the Chart
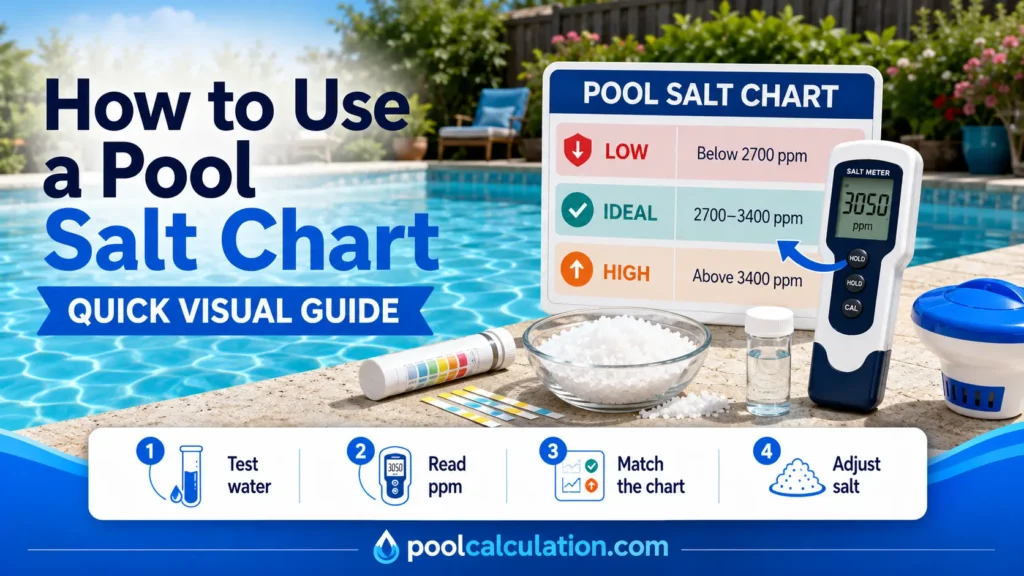
A swimming pool salt chart is useful only when the current and target readings are known. Subtract the current ppm from the target ppm, then find that increase beside the pool volume. The result is the approximate pounds of pure sodium chloride required.
This salt conversion for pool dosing uses the relationship between water volume and parts per million. It does not decide the target for you. The operating target must come from the salt chlorine generator manual.
Salt Amount by Pool Size
| Pool Volume | +500 ppm | +1000 ppm | +1500 ppm | +2000 ppm |
| 5000 gallons | 20.9 lb | 41.7 lb | 62.6 lb | 83.4 lb |
| 10000 gallons | 41.7 lb | 83.4 lb | 125.1 lb | 166.8 lb |
| 15000 gallons | 62.6 lb | 125.1 lb | 187.7 lb | 250.2 lb |
| 20000 gallons | 83.4 lb | 166.8 lb | 250.2 lb | 333.6 lb |
| 25000 gallons | 104.3 lb | 208.5 lb | 312.8 lb | 417.0 lb |
| 30000 gallons | 125.1 lb | 250.2 lb | 375.3 lb | 500.4 lb |
Convert Pounds into Bags
Divide the pounds by the bag weight. A result of 125 pounds equals about 3.1 bags of 40 pounds, five bags of 25 pounds, or 6.25 bags of 20 pounds. Buy enough product for the calculation but do not add every open bag before retesting. As this swimming pool salt chart explains, start with current measurements and reliable test results.
The Pool Salt Calculator performs the same conversion automatically and is better for an unusual volume or ppm increase.
Understanding Salt ppm for Pool Water
Salt concentration in pool water describes concentration, not the total weight stored in the pool. Two pools can both test at 3200 ppm while containing very different total pounds because their water volumes differ.
A change of 100 ppm may appear small, but it equals 8.34 pounds in 10000 gallons and 16.68 pounds in 20000 gallons.
Practical Chart Example
A 15000 gallon pool tests at 2300 ppm and targets 3200 ppm. The required increase is 900 ppm. The 1000 ppm chart value is 125.1 pounds, so 90 percent of that amount is about 112.6 pounds. As this swimming pool salt chart recommends, make changes gradually and verify the outcome.
Add roughly 100 pounds first, circulate, and retest. The final correction can then be made with a smaller amount.
When a Chart Should Not Be Used Alone
· The pool volume is only a rough guess.
· The salt test is old, unexpected, or taken before mixing.
· The salt product contains less than nearly pure sodium chloride.
· The generator target is unknown.
· The water is already above the operating range.
· A large amount of water was recently replaced.
Common Salt Chart Mistakes
· Reading the target ppm as the required increase.
· Using the 10000 gallon row for a larger pool.
· Rounding every value upward.
· Adding salt for a chlorine problem without checking salinity.
· Treating all salt systems as if they share one target.
· Testing beside a recently added pile of salt.
Use the Chart with Related Tools
Use the Pool Volume Calculator before the pool salt ppm chart when volume is uncertain. Use the Pool Salt Calculator for exact bag conversion. If salinity is correct but sanitizer is low, use the Pool Chlorine Calculator and troubleshoot cell output.
Adjusting the Chart for an Unusual Pool Volume
When the exact volume is not listed, scale the nearest row. A 12500 gallon pool is one and a quarter times the 10000 gallon row. Therefore, a 1000 ppm increase needs about 104.3 pounds instead of 83.4 pounds.
For a freeform pool, calculate volume first rather than choosing a row by appearance. Even pools with similar length and width can hold different amounts because of depth, benches, steps, and shallow shelves.
Why the Same Chart Cannot Diagnose Low Chlorine
The chart only converts a salinity increase into salt weight. It cannot show whether the salt cell is clean, correctly sized, receiving enough flow, or operating for enough hours. It also cannot measure algae or chlorine demand. As this swimming pool salt chart outlines, repeat the check whenever conditions change.
When salt is already inside the approved range, use chlorine testing and equipment troubleshooting instead of moving to another row on the chart.
Frequently Asked Questions
How much salt raises 10000 gallons by 500 ppm?
About 41.7 pounds of pure pool salt.
How do I calculate an amount not shown in the chart?
Use the Pool Salt Calculator or multiply gallons by the ppm increase by 0.00000834.
Does the chart apply to every salt brand?
It assumes nearly pure sodium chloride. Check the product label for purity and instructions.
Can the chart tell me the ideal salt level?
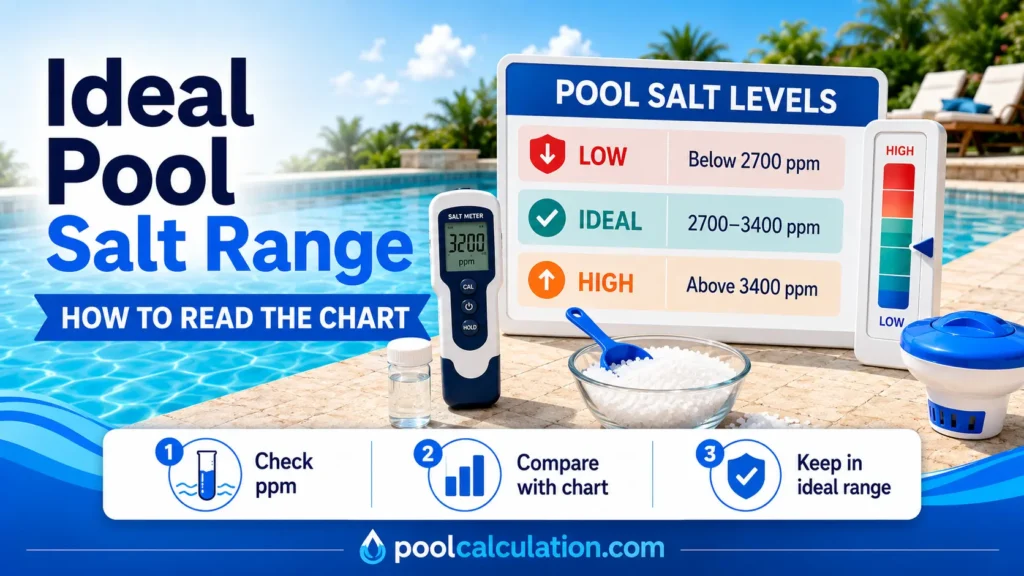
No. The generator manual provides the correct range.
Should I round bag quantities up?
Buy enough bags, but add most of the estimate first and retest.
Why is my result different from the salt system display?
Temperature, calibration, cell scale, mixing, and test method may affect the display.
Conclusion
A swimming pool salt chart makes common calculations quick, but the current reading and equipment target must be correct. Use the chart for planning, then use the Pool Salt Calculator for exact volume and bag size.